As its name suggests, the Dashboard view is an overview of all the Gantt tasks within a specified time range.
When first opened, the Dashboard assumes the same time range as the Gantt view.
The Full Dashboard option shows the same overview, but clears the results of any search criteria. It thus shows all the tasks in your overview by unselecting any active search criteria.
This view is displayed in table form, but can be adjusted in two ways:
- « Drag & drop »
By clicking and holding a column header with your mouse, you can drag the selected column to the left or right to change the order in which columns appear. This change is only temporary, and will be lost when you close the Dashboard window.
- Editing Headers
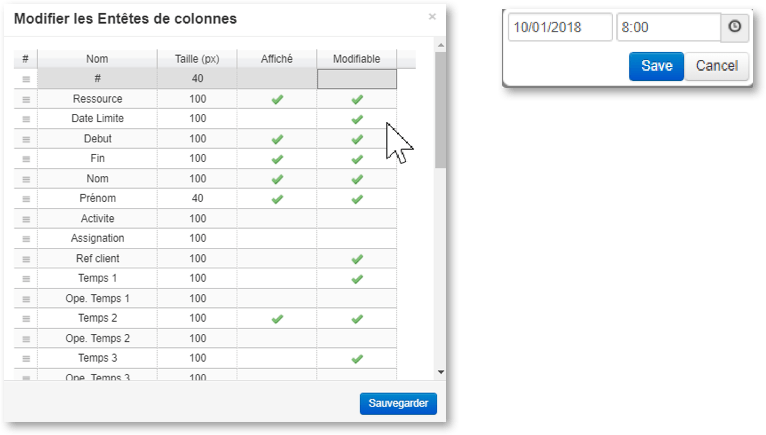
Accessible to the right of the End Date of your overview, clicking on this option opens a new settings panel.
Here, the user will find all of the columns shown in the Dashboard, column widths and two checkable columns, Display and Modifiable.
-
- Display: a green checkmark in this column indicates that this field will appear in the Dashboard View.
Modifiable: a green checkmark in this column indicates that the modification of the values contained in the task is possible from within the Dashboard view.
-
- As shown in the list above, the column on the far left contains slider tabs indicating that you can adjust the order of the rows using your mouse, by simply selecting and holding the row’s tab and moving it up or down in the list (see “Editing Headers” section above).
From the upper Function Menus Bar, it is possible to return to the Gantt view, or to print your Dashboard view.

The Generate Bar Codes option allows for the creation of bar codes that can be scanned with a scanner-type terminal.

For more information about this feature, please contact customer support at support@planilog.com.


